When you think of New Orleans, jazz music and Creole cuisine might come to mind, but the city also has a thriving automotive scene. While it's not known for car manufacturing, New Orleans excels in automotive sales, service, and a deep appreciation for classic cars.
The city’s love for vintage vehicles is evident in neighborhoods like the French Quarter and Garden District, where you’ll often spot beautifully restored classic cars cruising the streets. New Orleans also hosts notable events for car enthusiasts, such as the Fort Pike Festival and Car Show, where vintage cars take center stage.
When it comes to dealerships, New Orleans stands out for its exceptional customer service. Dealerships here maintain high review response rates, impressive Google star ratings, and a strong volume of customer feedback, showcasing their dedication to delivering a top-tier customer experience.
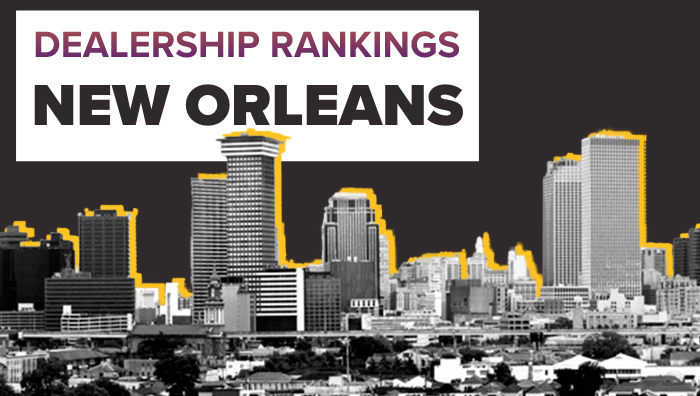
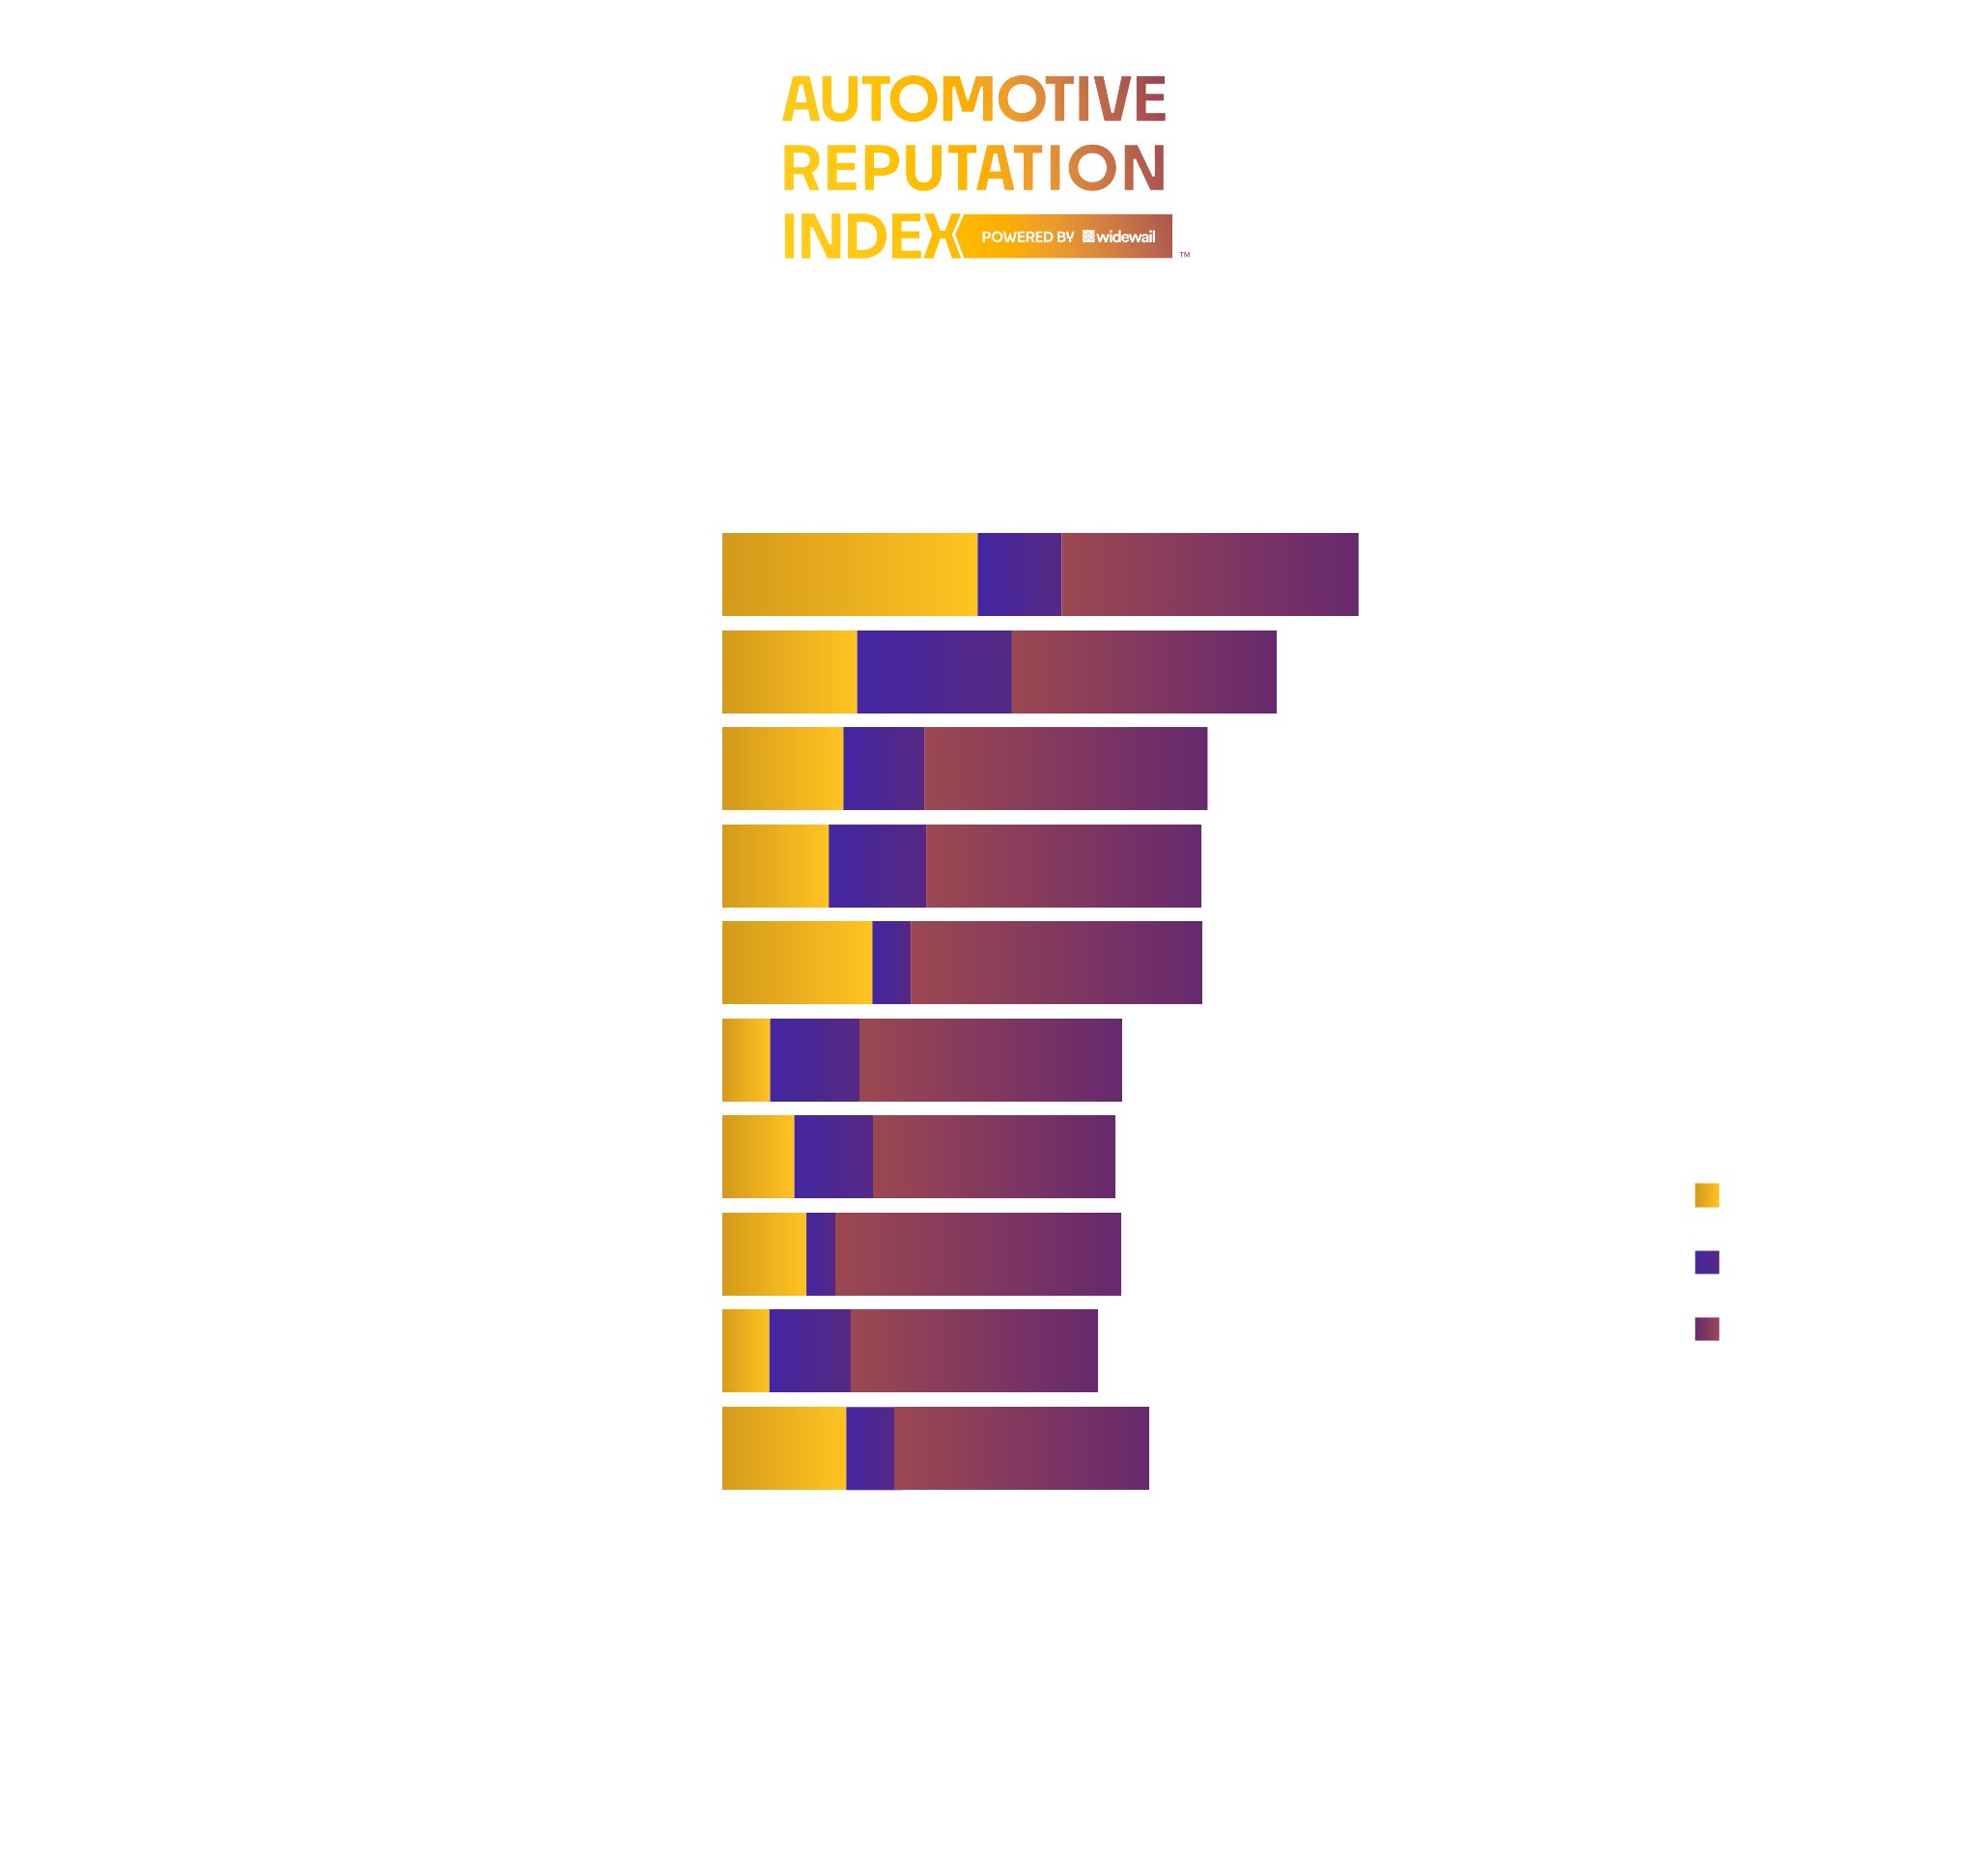
Using the Automotive Reputation Index, which ranks dealers by review volume, star rating, and review response rate, we’ve identified the New Orleans dealerships with the best online reputations.
- Royal Honda earns the best online reputation of all dealerships in New Orleans, with an overall health score of 89%. The dealer achieves this by having the highest adjusted star rating in the city, along with a strong and consistent relative monthly review volume.
- Competition for the top reputation spot in New Orleans is steep. There is only a 4-point difference in health score between the #5 ranked dealer, Matt Bowers Ford, and the #10 ranked dealer, Best Chevrolet. With health scores of 70% and 66% respectively, these dealers should both focus on increasing monthly review volume to set themselves apart.
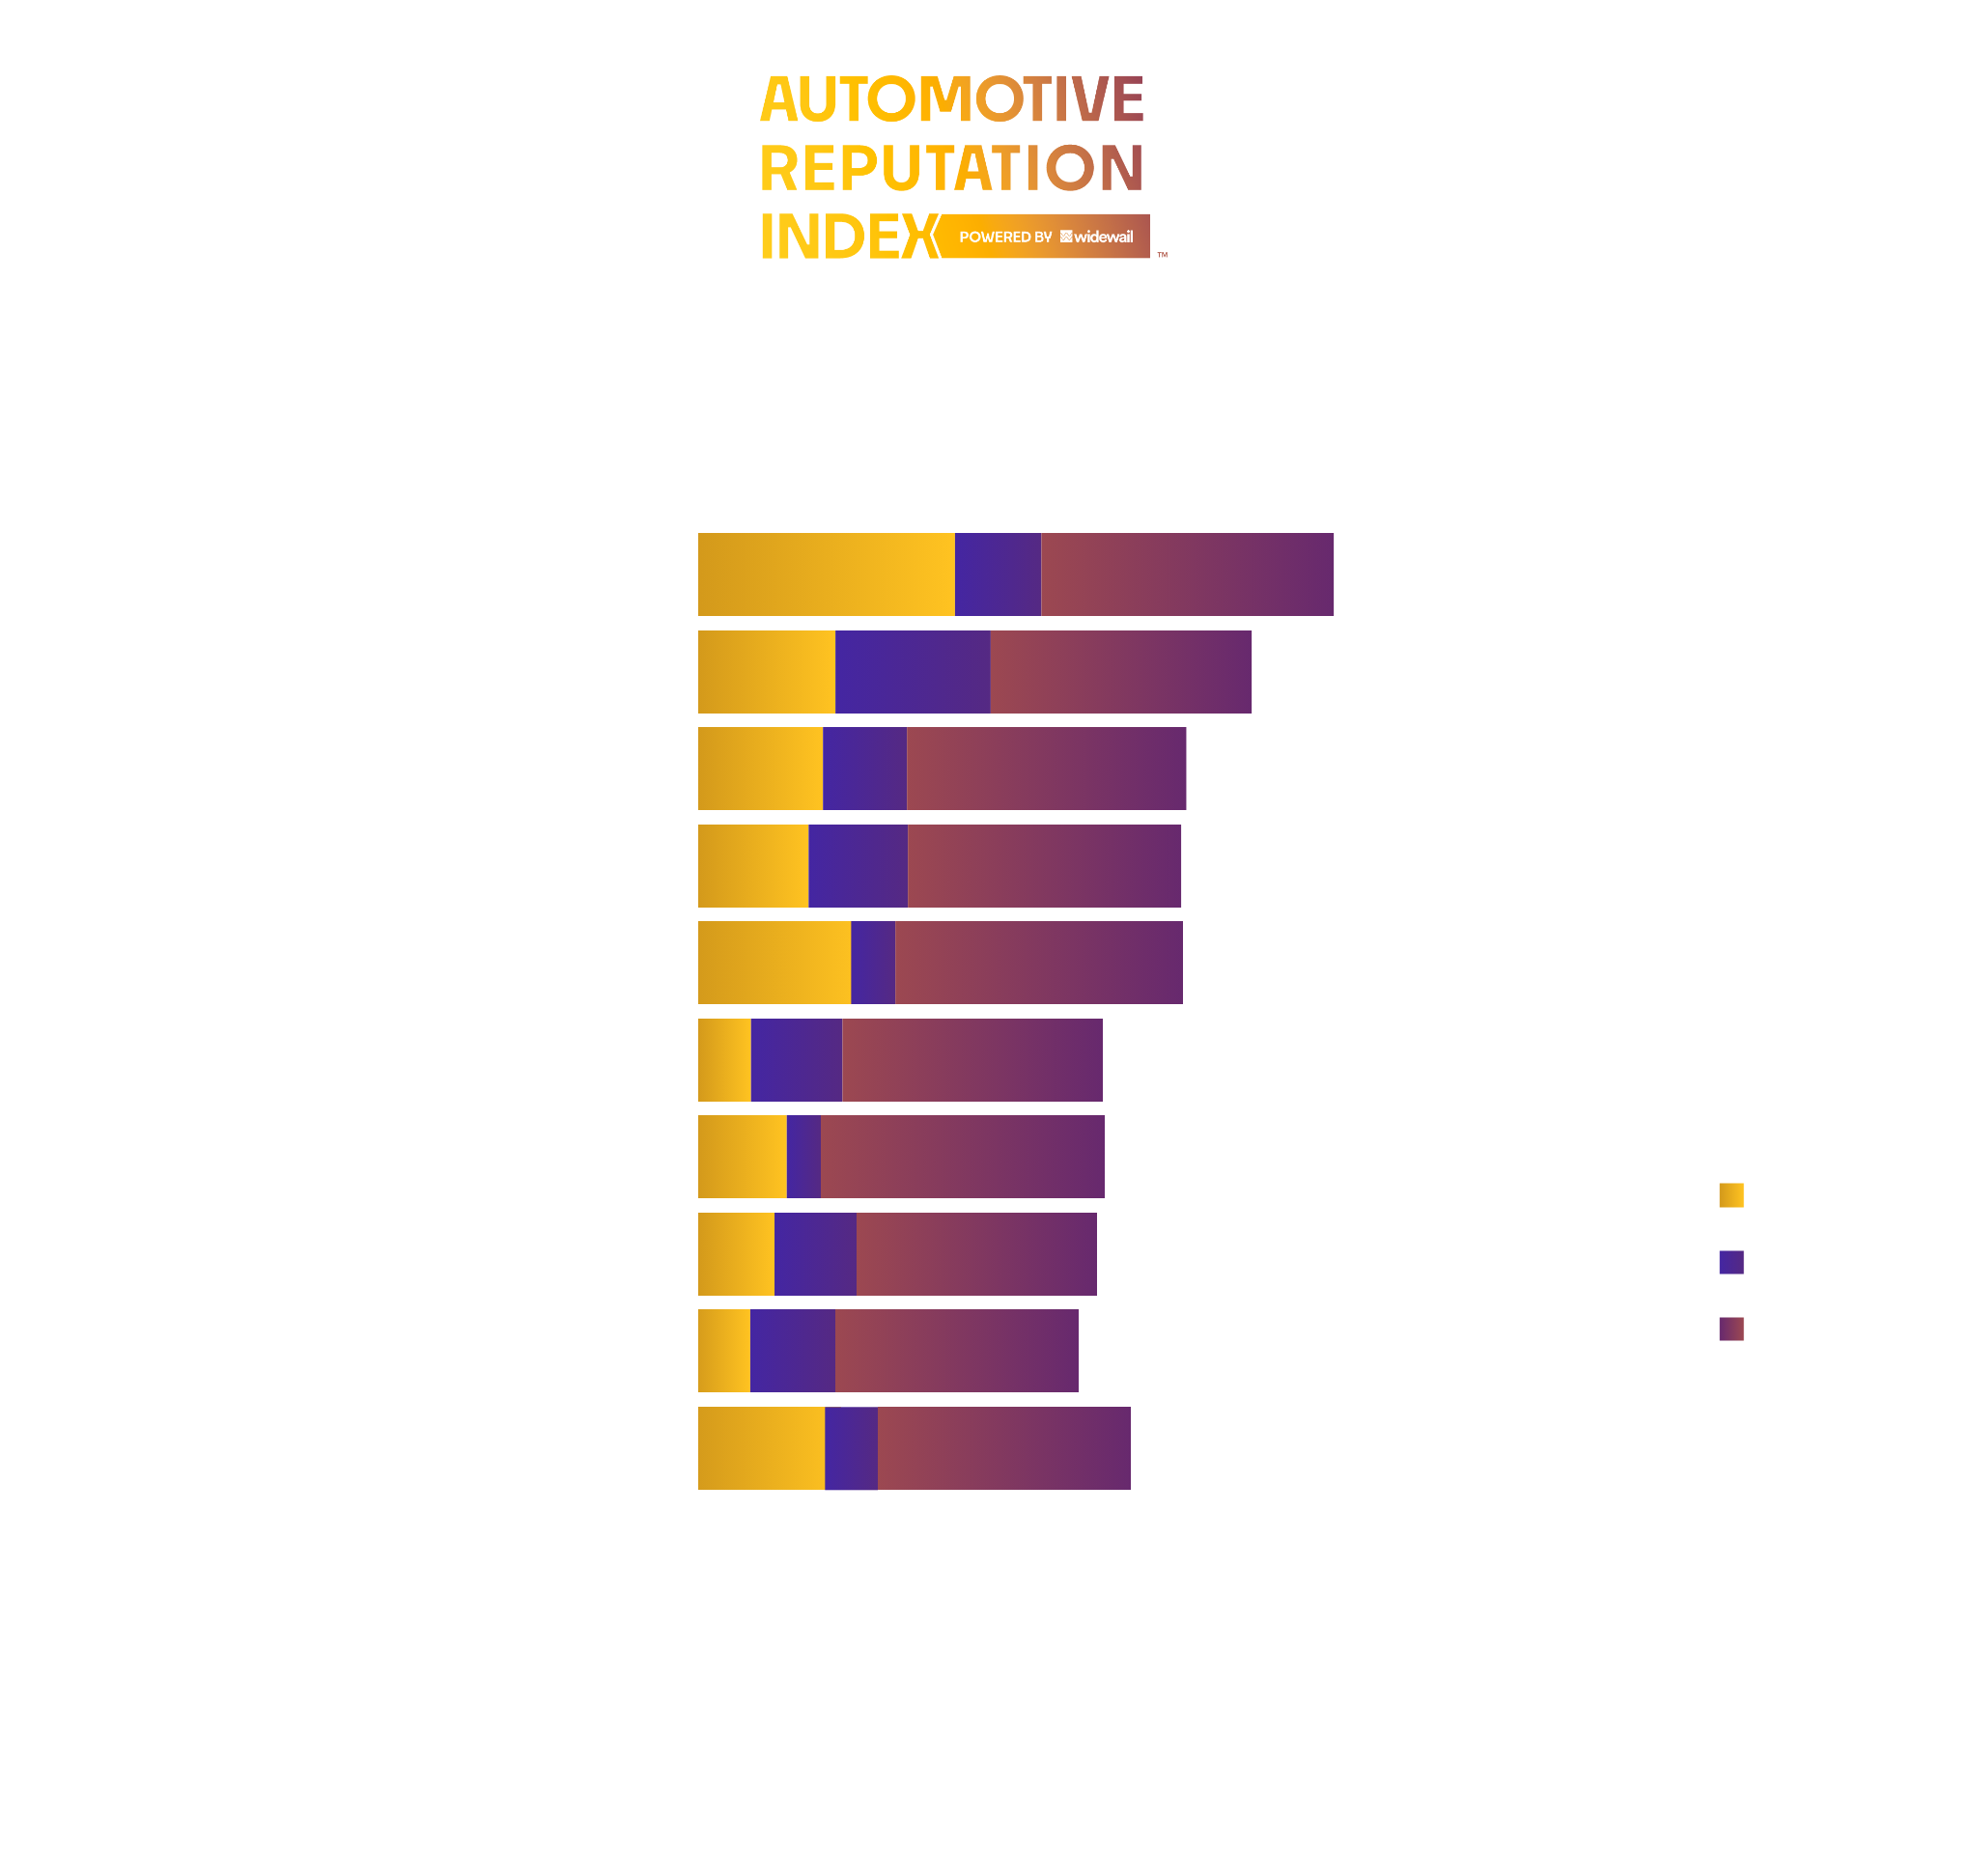
- Lexus of New Orleans secures the #1 spot out of all luxury dealers in New Orleans. This dealer outperforms with a high adjusted star rating and a nearly perfect response rate of 98%.
- The bottom two dealers, Walker Acrua and Tesla New Orleans are mainly suppressed in the rankings due to having response rates of 0. To improve their reputations, these dealers must respond to every review. Consistent review responses would work to make these dealers more credible and trustworthy to Google’s algorithm, boosting search ranking as well as customer trust. This strategy could be achieved by partnering with a reputation management service, which would help them both to respond to generate review content.
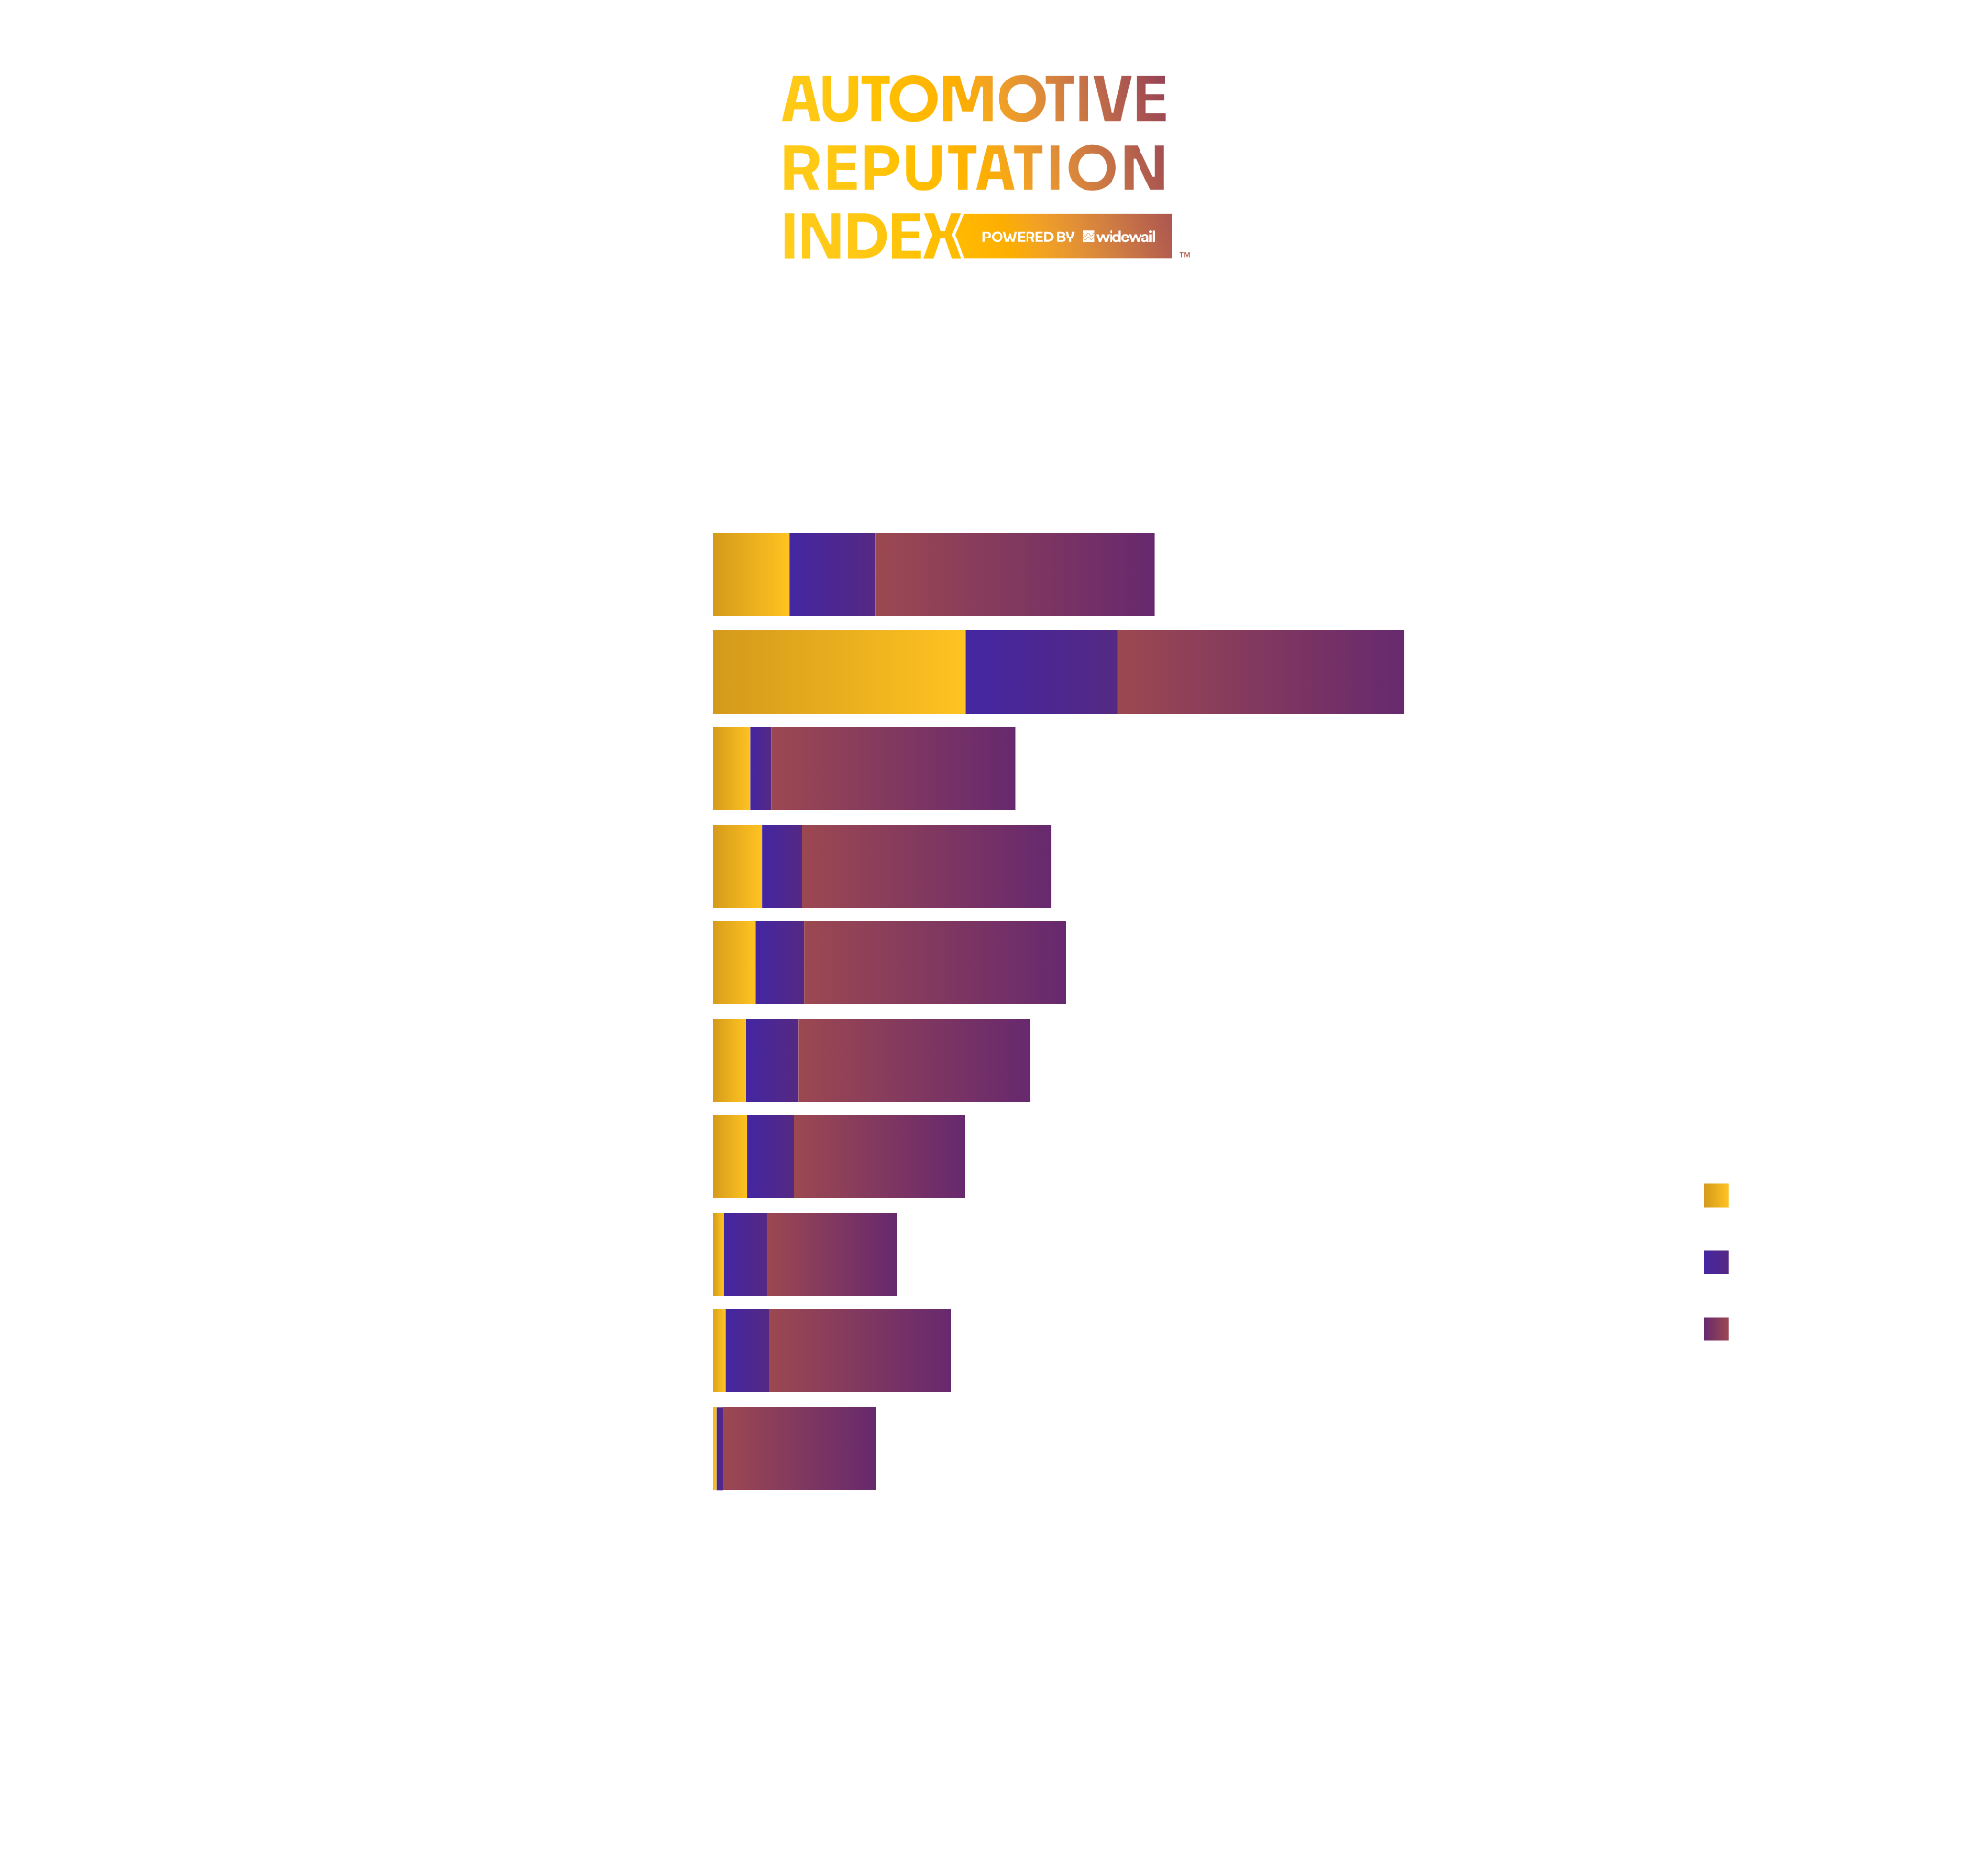
- Turning to the top non-luxury dealers, Royal Honda again finds itself at #1. Consistently positive reviews have paid off, propelling this dealer to the top of the rankings and proving its commitment to delivering an outstanding customer experience.
- Premier Nissan Of Metairie has the second-best online reputation of non-luxury dealerships in New Orleans. The dealer outperforms its peers in lifetime review volume and has a nearly perfect response rate of 99%. For a chance to dethrone Royal Honda in the rankings, Premier Nissan Of Metairie should focus on improving its monthly review volume. The dealer could achieve this by asking every customer for a review or by investing in a consistent review solicitation strategy.
- All of the non-luxury dealers in New Orleans are also featured in the overall ranking list. This illustrates that these dealers stand out overall in the city, not just within their category, and are dedicated to developing and sustaining their online reputations.
*Note from the editor. The Automotive Reputation Index offers substantial coverage of the nation’s dealerships, but it’s still growing. If your dealership is not yet listed on the Index and you’d like to add it, submit your information and we will add it during a regularly scheduled update, roughly once per month.
Widewail's rankings are based on the Widewail Automotive Reputation Index. Explore the full dataset:

Ranking Methodology
To rank these dealerships fairly, we chose a method that considers the fact that dealerships on our list receive a wide range of monthly review volume, in part due to varying levels of opportunity. For example, luxury brands can never sell as many cars as non-luxury brands, the price point limiting a luxury dealership's market.
To compare two dealerships with very different review volumes directly wouldn’t be fair. A dealer with two 5-star reviews doesn’t necessarily deserve to be ranked higher than a dealer with 200 reviews and a 4.5-star rating. With few reviews, the former doesn’t offer enough data for us to use to understand its performance. However, we couldn’t just ignore locations with very few reviews, as that would introduce bias into our rankings.
To solve this, we used "adjusted ratings" in our calculation of dealership ranking. In essence, "adjusted rating" is a dealership's star rating that takes into account how its review volume compares to that of other dealerships in that area. We calculated adjusted ratings by using a technique called additive smoothing which we explain below.
Additive Smoothing
The approach we’ve used is a form of what’s called “additive smoothing.” This process allows for an unbiased way to rank two otherwise unequal dealerships. At its core, additive smoothing levels the playing field by artificially increasing the number of reviews each dealership has by adding the same number of reviews of each star rating to every dealership.
Customer Engagement
Additionally, we take into account the percentage of reviews that a dealership has responded to in our calculation of ranking, as Widewail strongly believes that review response is indicative of a strong reputation strategy.
Activity
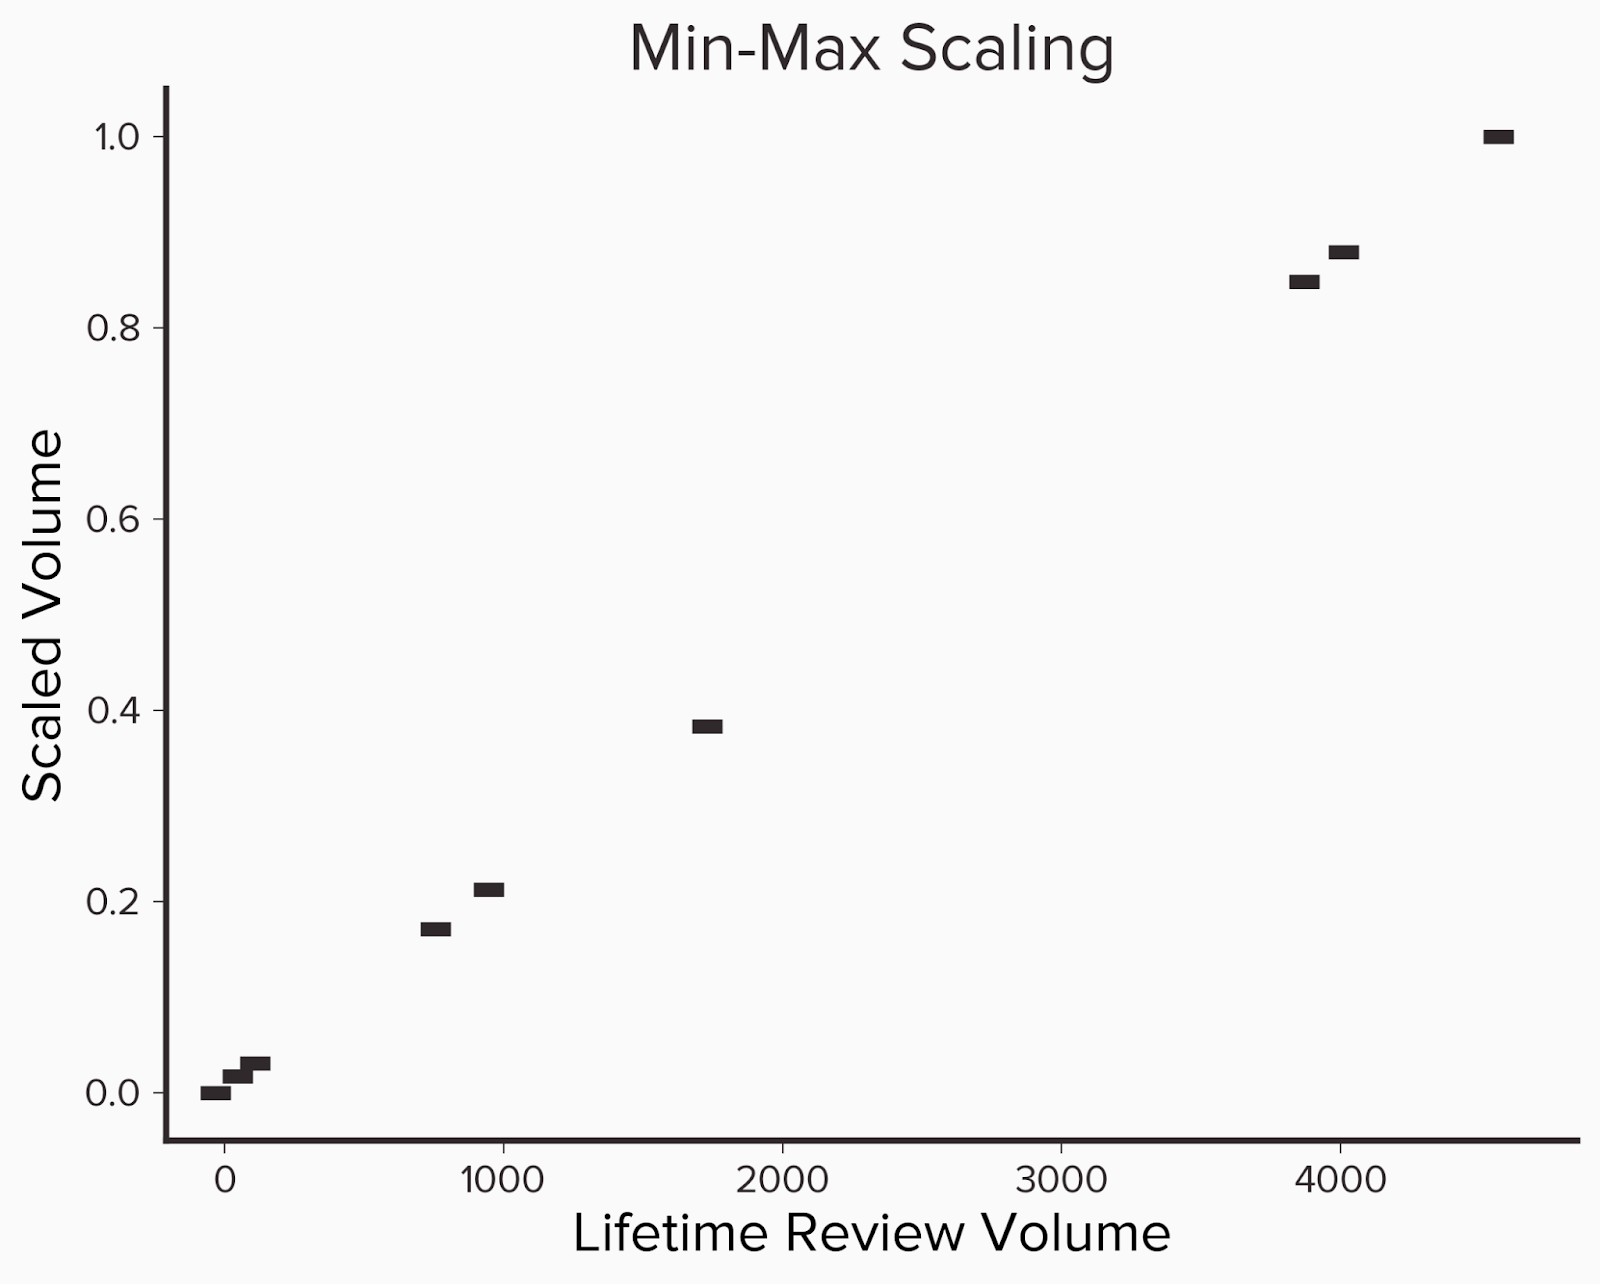
The last component revolves around how much review volume a dealership receives, which can be broken down into two parts - their lifetime volume and average monthly volume. Lifetime volume can be thought of as a popularity metric. It’s an important metric and one of the first numbers that a potential customer will see when they start looking at reviews. The second, average monthly review volume, is representative of how active the dealership currently is. We can think of it as follows, lifetime volume captures a historical view of the dealership whereas average volume gives insight into the current status. The final component for the volume metrics is to scale them so there is a more meaningful comparison. To do this we use what is known as min-max scaling. First we group dealerships by their respective city and then find the dealership with the most volume and least volume. Then for each dealer in the group, we subtract the lowest volume and divide by the difference between the highest and lowest volume. The formula for this can be seen below.
x' = x - min(x)max(x) - min(x)
The main advantages of this approach are that all the volume metrics can be mapped to a value between 0 and 1 and the relative difference between dealership volumes can still be preserved.
Below we see an example of this where we have 9 dealerships with differing lifetime volumes, which we then scale. Notice that the relative distance between the actual volumes and the scaled versions is the same.
Below we have an example of ten dealerships, their review volume, and the adjusted relative volume. We can calculate the relative volume by sorting the dealers by review volume and determining the percentage of dealers that have fewer reviews. Here we see that dealer D had the most reviews and so they get a score of 1.
|
Lifetime Volume
|
Scaled Volume
|
|
4619
|
1
|
|
4065
|
0.88
|
|
3922
|
0.85
|
|
1783
|
0.38
|
|
1001
|
0.21
|
|
810
|
0.17
|
|
164
|
0.03
|
|
101
|
0.02
|
|
22
|
0
|
The Ranking Formula
(adjusted rating / 5) * 0.3 + (response rate) * 0.3 + (lifetime volume) * 0.15 + (avg monthly volume) * 0.25
Weighting Rational
We chose to weigh each feature as follows: adjusted rating accounts for 30% of the overall score, response rate also accounts for 30%, and review volume is 40%, which is further broken down into lifetime volume (15%) and average monthly volume (25%).
Weight selection is based on Widewail’s depth of expertise in the industry and we believe is a fair representation of what should be considered a standout reputation.
We’ve broken the weighs into three categories:
Activity (40%)
We believe the amount of review activity is the most important indicator of reputation health for a business, and is a leading driver of local search rankings. We’ve broken this category into two components: lifetime volume (15%) and frequency (25%). Lifetime volume is our “popularity” metric.
Engagement (30%)
Engaging with customers by responding to reviews is a key component of a healthy reputation.
Quality (30%)
Rating has a substantial impact on if a business shows up in local searches and if that business is entered into a prospect’s consideration set. Rating is a key identifier of business health.
Calculation Details
If a company has an adjusted rating of 4.2, responds to 10% of their reviews and has an adjusted lifetime volume of 0.90 in their city and 0.87 for their scaled average monthly review volume, then we would calculate their overall rating as follows
(4.2 / 5) * 0.3 + (0.1)*0.3 + (0.9)*0.15 + (0.87)*0.25 = 0.252 + 0.03 + 0.135 + 0.2175 = 0.6345 * 100 = 63.45
Note: Since response rate accounts for 30% of the overall ranking, if a dealer doesn’t respond to any reviews that automatically caps the max value they can receive to 70.