Access Reputation Index & More

The most comprehensive reputation data resources in automotive, brought to you by Widewail.
  • Widewail Automotive Reputation Index
  • The REV Newsletter (1x/month)
  • Industry Reports

1 of 6

Automotive Index Training: Basic Actions

Sort

  • In the top toolbar, click “Sort”

  • Select a column title in the dropdown menu and sort in ascending or descending order

  • Add multiple sorts for additional layers of ordering

2 of 6

Automotive Index Training: Basic Actions

Filter

  • In the top toolbar, click “Filter”

  • Focus on certain areas by filtering by categorical fields like "Brand" or "City"

  • Set conditional filters like "all dealers with an average rating greater than 4"

3 of 6

Get to Know the Reputation Data

This Widewail Automotive Reputation Index dataset consists of:

  • 16,671 new car dealers in the U.S.

  • 1.6M reviews

  • Google reviews only

  • Current Timeframe: February through June of 2023

4 of 6

What Does This All Mean?

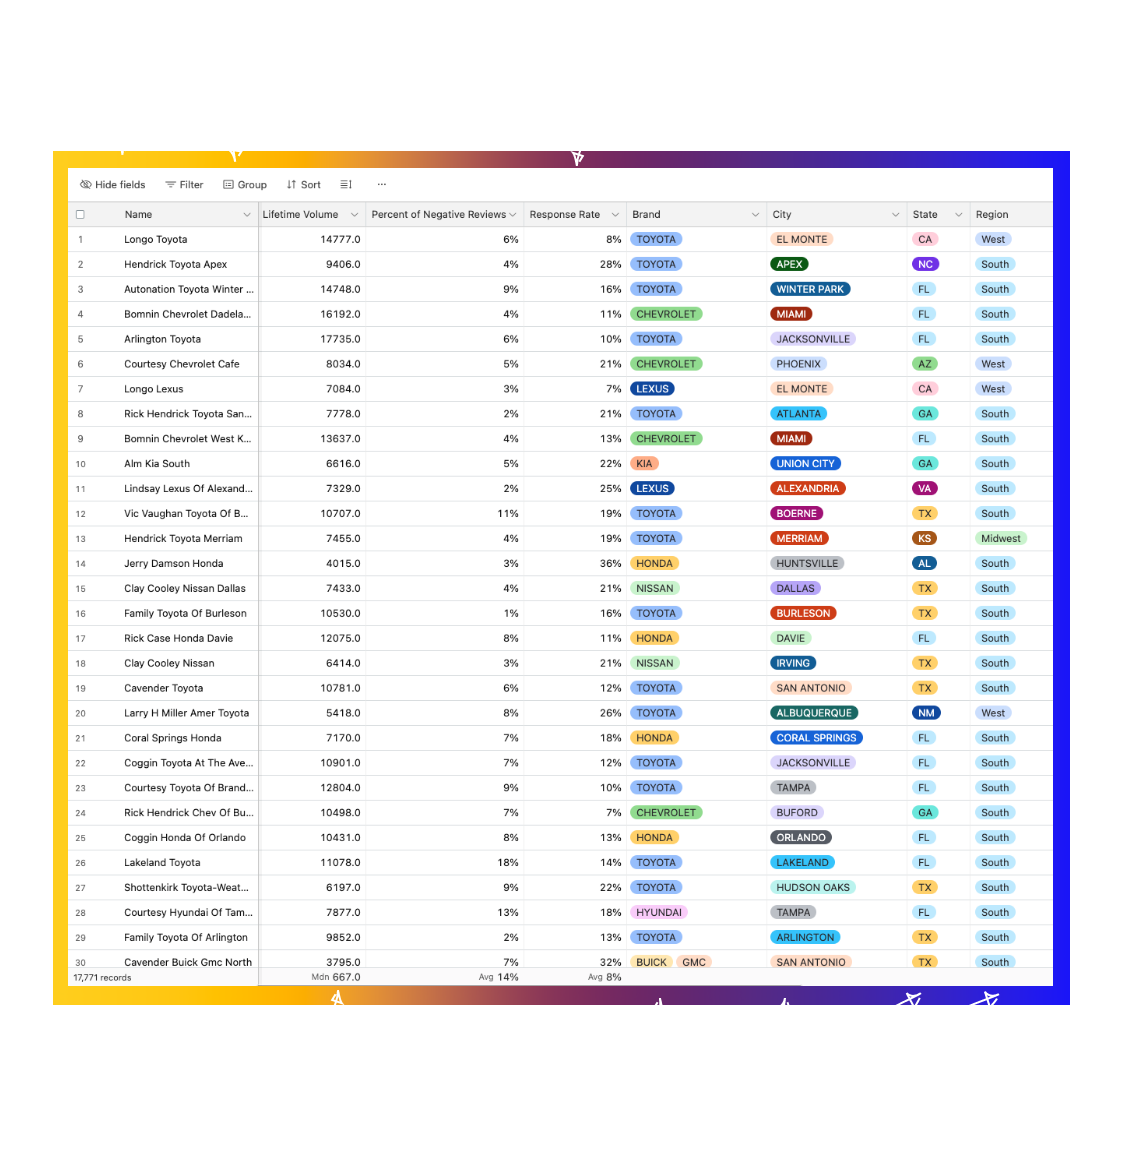
Find definitions of each column header

In the row of column headers, you can hover over the ⓘ symbol next to each label to read the definition of what is being measured in that column and how the data was collected. 

5 of 6

Where to Find Benchmarks

At the bottom of the table, you'll find aggregated numbers for each column. These are the benchmarks. We've preset the benchmarks in each column for you.

The benchmark data updates as you filter and sort the table, producing thousands of variations, each specific to your market or interests.


6 of 6

Common Use Cases & More

Below the Reputation Index table, you'll find a Common Use Cases section to get you started. Each common use case includes a how-to video.

The Automotive Reputation Index is ever-evolving. Check back regularly for updated data and new use cases. If your dealership is missing and you’d like to add it to the Index, select “Submit a request to add.”

Get Started
WARI-Header-Logo

Reputation datasets to help the automotive industry benchmark reputation, map local markets and discover rankings.

✔ 8.1M Google reviews

✔ 18,000+ new car dealers

✔ 17 reputation, business & geographic data dimensions

Explore (It's Free)
Minisite banner tall-2

Explore Automotive Reputation Datasets & Reports

The Index

Refreshed Quarterly

The most comprehensive public reputation dataset in the automotive industry. This free dataset tracks the reputation performance of 16,000+ new car dealers. Sort, filter, rank, benchmark. It’s purposefully flexible. See what you can uncover.

Get Free Access

Reports

Exclusive Research

Industry insights and observations sourced from reviews, based on Widewail’s proprietary voice of customer research. Understand what automotive buyers are thinking and what makes them happy today.

Explore Reports

Local Markets Index

Regular Updates

Reputation benchmark data for every city and state in the US. Find out what you need to do to compete in your local market.

Get Free Acess

City Rankings

New rankings monthly

Reputation rankings specific to local markets. Track which cities are the most competitive.

Explore Cities

The REV Newsletter

Every 3 Weeks

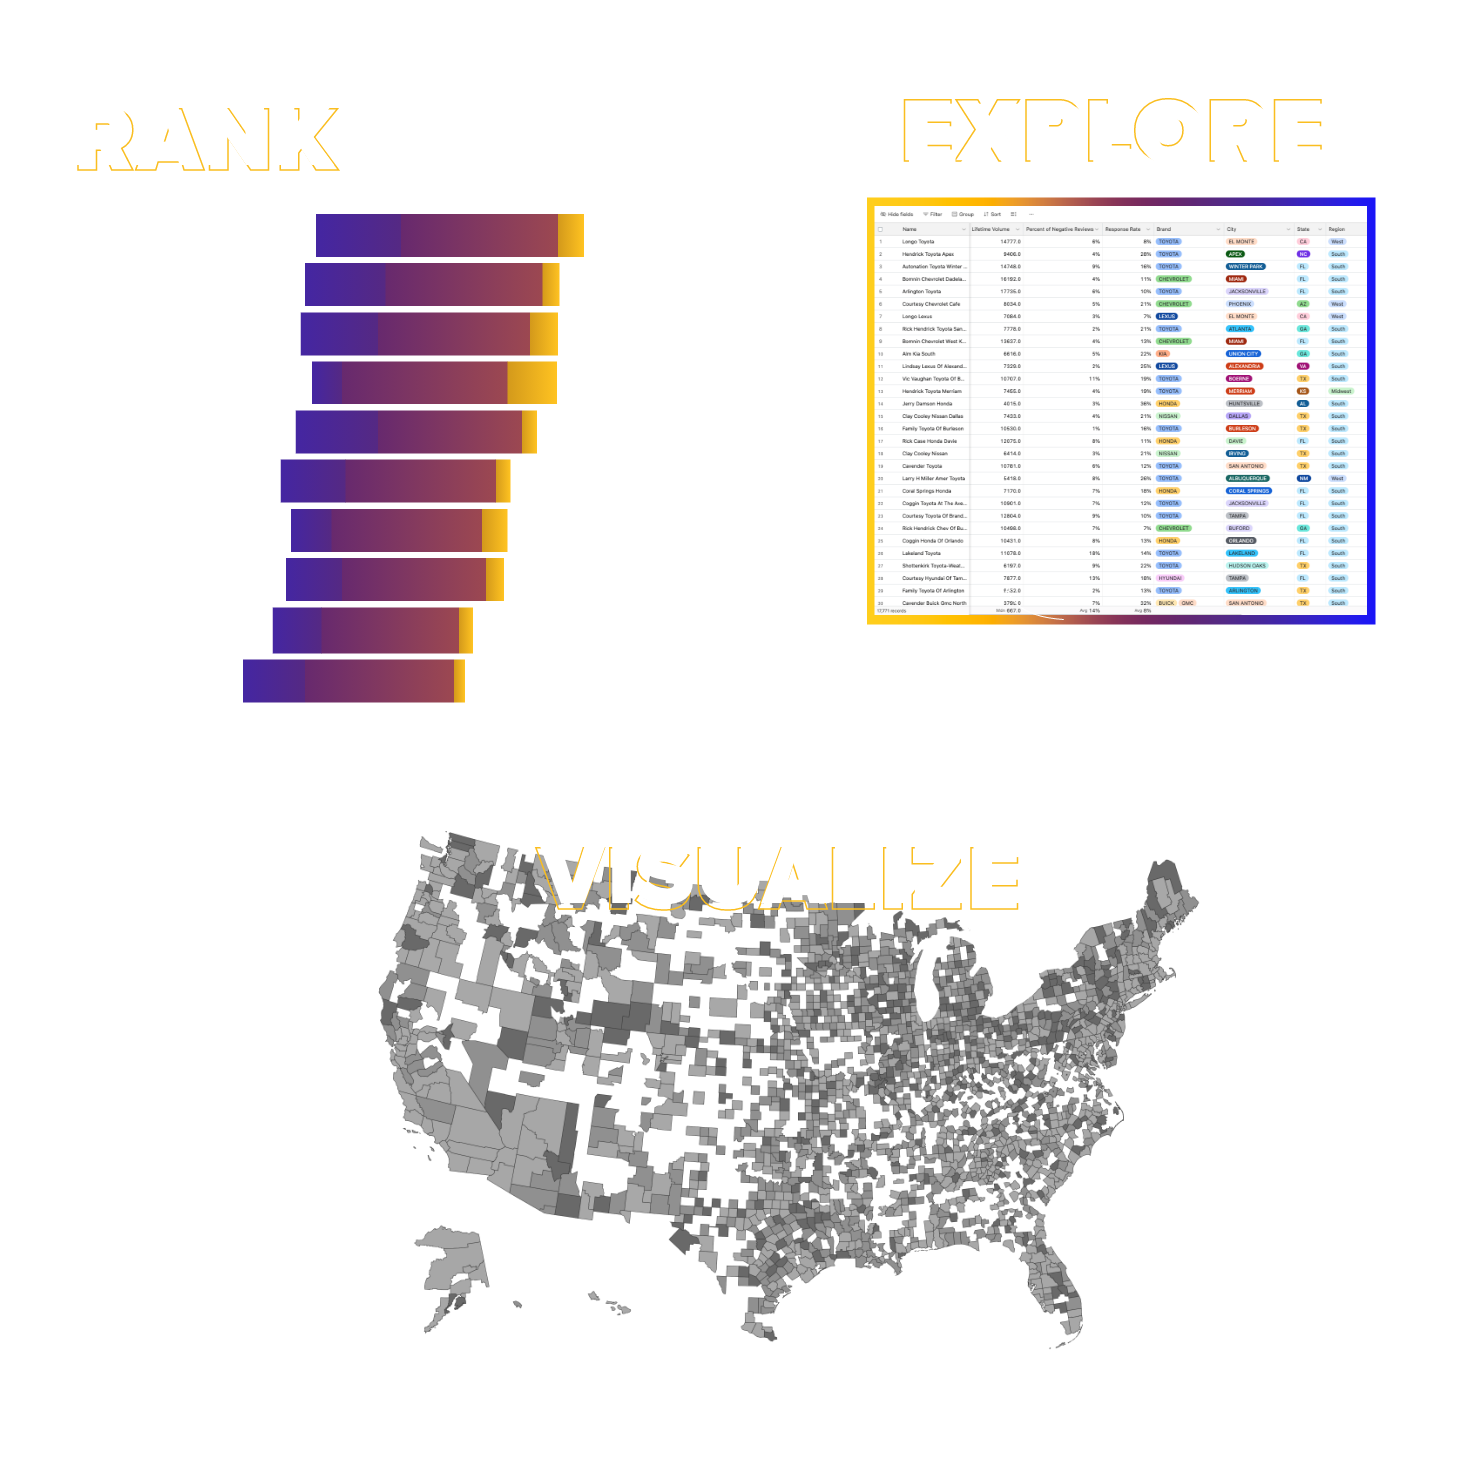
A briefing on what car buyers want surfaced 100% from Google reviews. Every 3 weeks we Rank, Explore & Visualize automotive reputation & sentiment data. From the Automotive Reputation Index to your inbox.

Read & Subscribe

Ways to Use This Data

1

Local Market Rankings

Map the competitive landscape in any US city, state or region.

2

OEM Reputation Comparisons

See reputation benchmarks filtered by brands.

3

Ultimate Benchmarking Tool

Filter columns and set benchmarks by reputation data, firmographic data or brand.

4

Up-To-Date Consumer Insights

What car buyers want, gathered from the latest review data.

Preview the Index: Common Use Cases + Video

I’m a dealer and I want to see how my dealership ranks in my local area

  1. Sort: Sort the table by your preferred data dimension. We recommend Volume Per Month (Avg). To sort from highest to lowest, click the arrow drop-down next to the column header and select “Sort 9 > 1.”
  2. Filter by State: Select the filter tool at the top of the table. Select “Add Condition.” Show records where “State” “is” your state or your state of interest.
  3. Filter by City: If you’d like to go deeper, you can filter by city. Show records where “City” “has any of” and identify the cities of interest. (*Note: When researching your local market we recommend you filter by a collection of cities surrounding your dealership. Generally speaking, a single city selection is too narrow to accurately describe your competitive set.)

I want to see the median monthly review volume for dealerships in a state

  1. Sort: Sort the table by your preferred data dimension. We recommend Volume Per Month (Avg). To sort from highest to lowest, click the arrow drop-down next to the column header and select “Sort 9 > 1.”
  2. Filter by State: Select the filter tool at the top of the table. Select “Add Condition.” Show records where “State” “is” your state or your state of interest.
  3. Navigate to the bottom of the table frame to find the aggregate records for each column. At the bottom of the Volume Per Month (Avg) column you’ll find the median review volume average for the currently filtered view. We recommend starting with the median because it’s more resistant to outliers than the mean. Hovering over the aggregate metric at the bottom of the table & clicking will provide access to a list of alternative summarization metrics, which you can feel free to experiment with in any manner. (*Note: Resetting filters will not reset the metric used to calculate aggregate records, so remember you’ll need to reset it yourself if you’d like to revert to the original summarization metric.)

I want to see the reputation data for all dealerships in the state from a specific OEM

  1. Sort: Sort the table by your preferred data dimension. We recommend Volume Per Month (Avg). To sort, click the arrow drop-down next to the column header and select “Sort 9 > 1.”
  2. Filter by State: Select the filter tool at the top of the table. Select “Add Condition.” Show records where “State” “is” your state or your state of interest.
  3. Filter by Brand: Select “Add Condition.” Next, fill out: Where “Brand” “is exactly” "insert the manufacturer brand(s) you represent." You can select as many brands as you like. To deselect a brand from your list, find the brand selected in the drop-down list and toggle the button.

I want to see what the average rating is for all dealerships in the US

With no filters selected, scroll to the bottom of the table window to find the average rating in the Rating Per Month (Avg) column. This metric is specifically from data this year. “Lifetime Average Rating” describes the rating of the dealership you’d find on Google at the time of the data collection, which we update monthly.

I want to see how the surrounding population impacts review volume or rating

You’ll find a rough estimate of the regional population for each dealership in the “Surrounding Population” column. This column can be filtered and sorted from largest population to smallest by selecting Z→A and further filtered by state or city or brand, depending on what cohort of dealers you are interested in.

I want to see what the average percentage of negative reviews is for a dealership

  1. Find a dealership using the search icon in the upper right corner of the table
  2. Horizontal scroll over to the “% Percent of Negative Reviews” column. This number represents the percentage of a dealership's reviews that are 1, 2 AND 3 stars. Put another way, any review less than 4 is considered negative. 

(*Note: the average % of negative reviews is calculated based on the new reviews that came in during the time period we looked at. So if a dealership only got 10 reviews in 2023 and half were negative, then % of negative reviews would show as 50%.)

I want to compare the reputation performance of dealerships that are part of a group to those that are single locations

  1. Filter by Branch Description: Select the filter tool at the top of the table. Select “Add Condition.” Show records where “Branch Description” “is” and select the type of dealership you’re interested in. 
  2. Recommendation: filter by “branch,” note the benchmark performance via the bottom of the table, and then filter again for “single location,” recording the same data. With this, you’ll be able to compare the benchmark performance specific to those types of dealerships. Go deeper by filtering by brand or state.

I’m an OEM rep and I want to see all the dealers for my brand in my region

  1. Sort: Sort the table by your preferred data dimension. We recommend Monthly Average Review Volume (Volume Per Month (Avg). To sort, click the arrow drop-down next to the column header and select “Sort 9 > 1.”
  2. Filter by Region: Select the filter tool at the top of the table. Select “Add Condition.” Show records where “Region” “is” your territory. You can select as many regions as you like.
  3. Filter by Brand: Select “Add Condition.” Show where “Brand” “is exactly” the manufacturer brands you represent. You can select as many brands as you like.

I want to reset all filters

  1. Remove filters: click the filter tool and press the trash can icon on the right next to each condition added.
  2. Remove “sorted by” conditions: click the sort tool and, if you have sorted any columns by magnitude, then click the “X” on the right next to the column sorted to reset that column.
REV Newsletter - Website banner – 1

Welcome to The REV. A briefing on what car buyers want surfaced 100% from Google reviews. Every 3 weeks we Rank, Explore & Visualize automotive reputation & sentiment data. 

Insights from the Automotive Reputation Index to your inbox.

Read & Subscribe
REV Cover Graphic