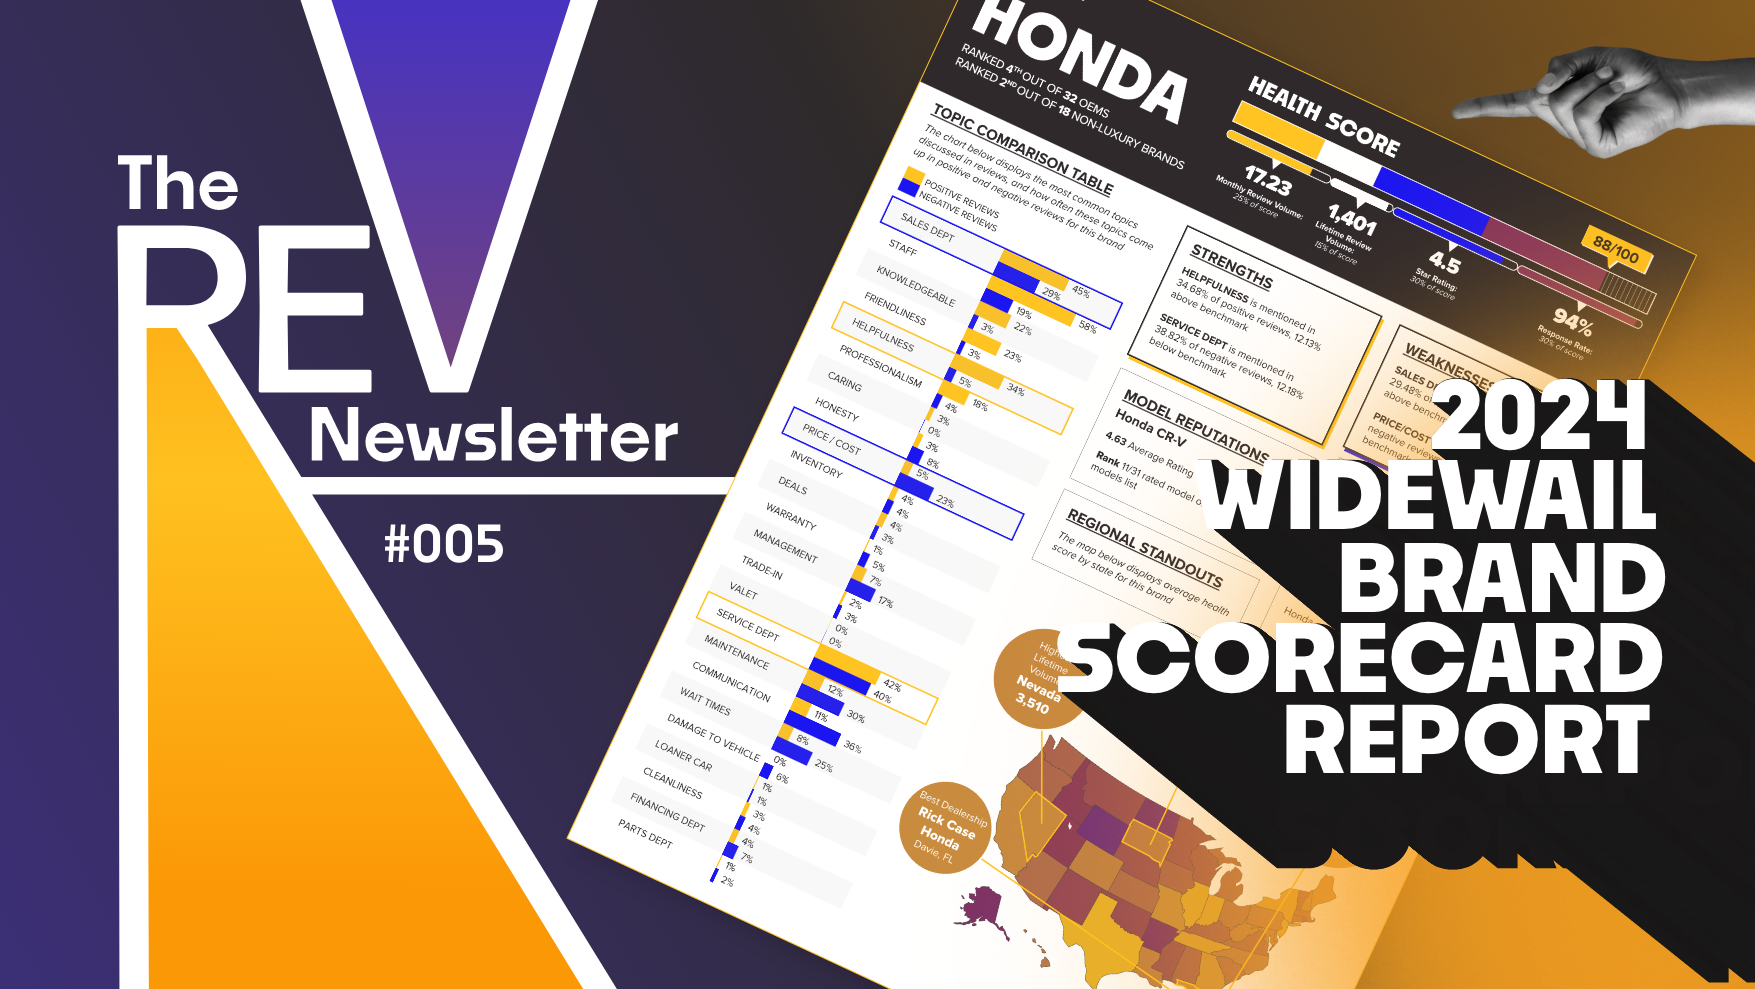
Welcome to the REV. A briefing that goes deep into the Widewail Automotive Reputation Index data, surfacing the most interesting insights. Every 3 weeks we Rank, Explore & Visualize automotive reputation & sentiment data.
We just launched the 2024 Brand Scorecard Report which ranks the 32 most popular automakers based on Widewail Automotive Reputation Index data. Today’s REV highlights the biggest takeaways from the report. Find the full Brand Scorecard Report here.
RANK
OEM Reputation Rankings, 2024
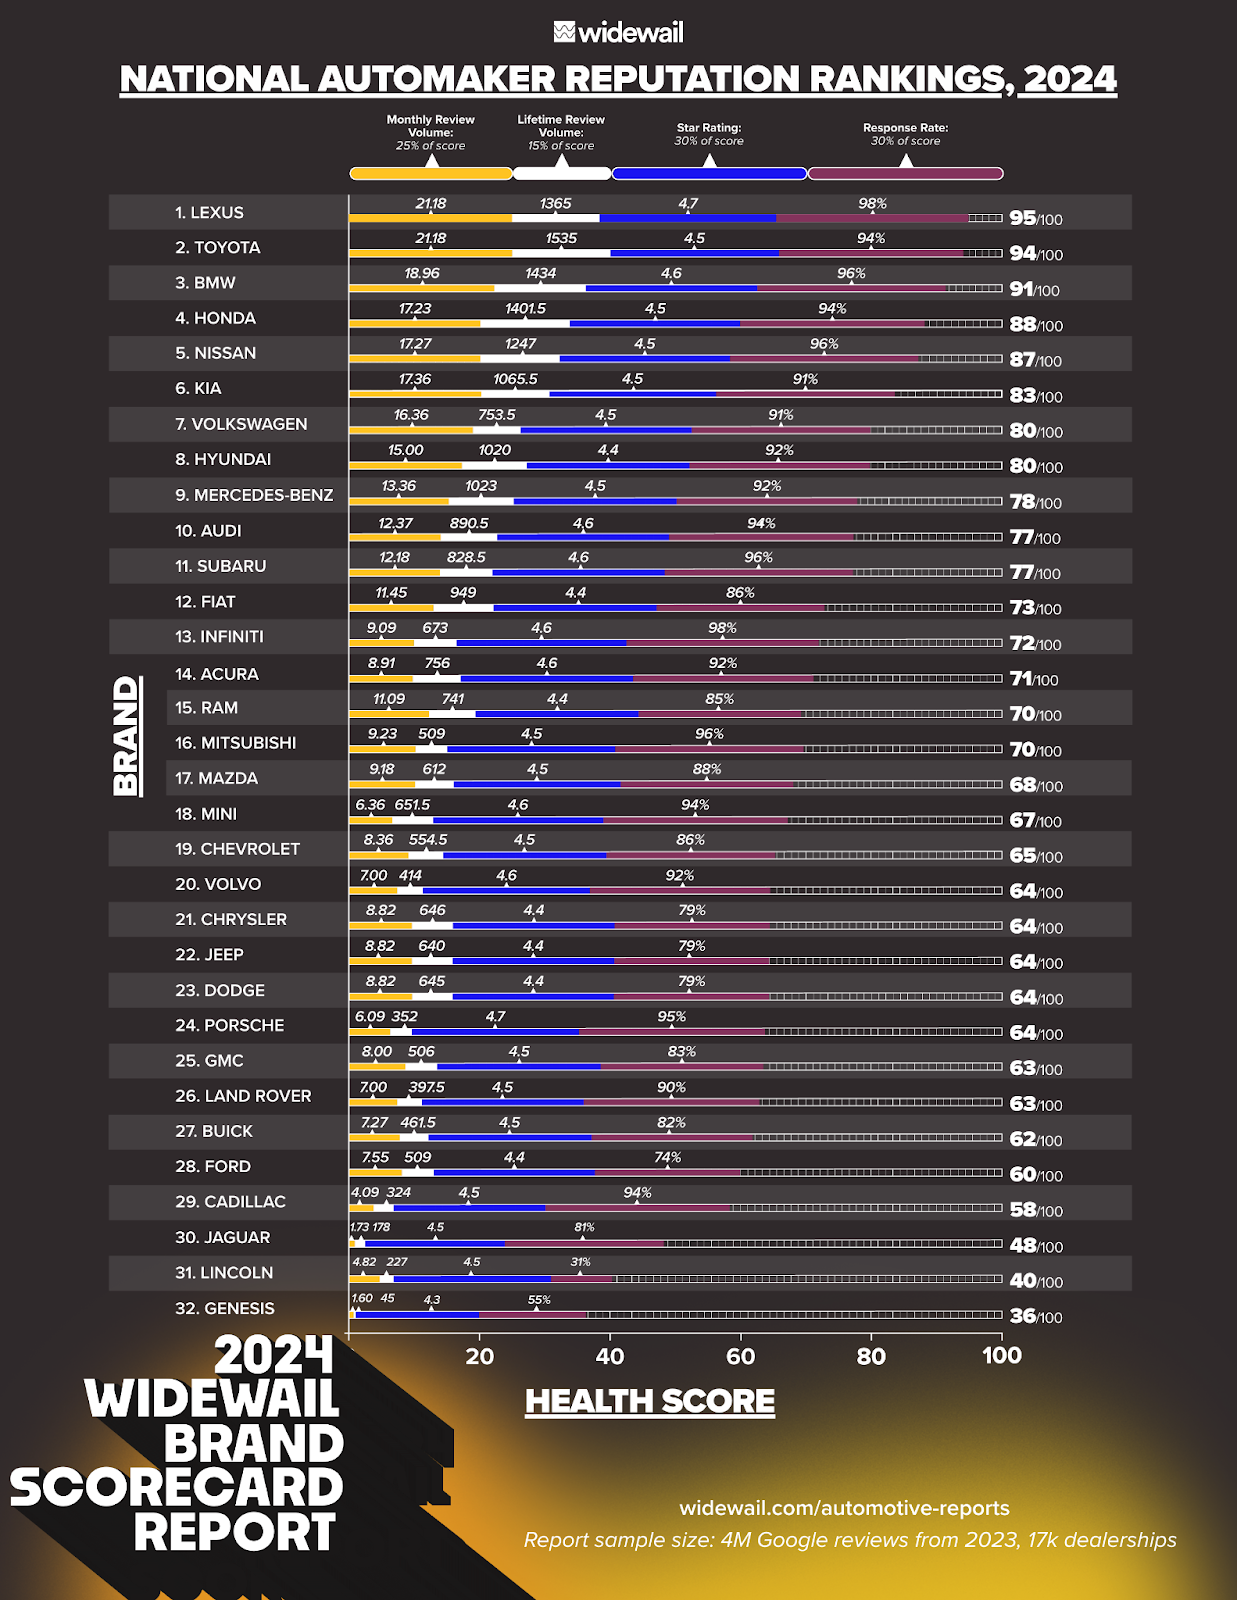
Widewail’s new study, The Brand Scorecard Report ranks 32 OEMs based on Google review data indicating what customers think of them.
We looked at 4,159,000 Google reviews from 2023 to rank Automaker's reputations. This is our first year publishing the report; we’ll update it annually.
And the winner is (drumroll)...
Lexus 🎉
All the Way Up
Lexus is ranked #1 based on outstanding performance in four reputation metrics: lifetime review volume (1,365), monthly review volume (21.2), average star rating (4.7) and review response rate (98%).
Toyota is ranked #2. Its dealerships have the highest average lifetime review volume of any brand: 1,535.
BMW is ranked #3 with a high monthly volume of reviews (18.96) and high review response rate (96%).
All the Way Down
Genesis is ranked last, at #32, primarily because of its tiny monthly (1.6) and lifetime (45) review volume. Its 55% review response rate doesn’t help, either. For perspective, the median monthly Google review volume per dealership in 2023 is 10.4. 366 dealerships in the Widewail Reputation Index averaged over 100 monthly reviews in the calendar year 2023.
Lincoln is ranked #31, with a low monthly volume (4.8) and a higher-than-Genesis lifetime review volume (227).
At #30, Jaguar can feel better about its 81% review response rate, but its low monthly (1.73) and lifetime (178) review volumes drag it down the rankings.
See which brands earn spots #4-29 in the Brand Scorecard Report.
EXPLORE
Lexus is World-Class at Minimizing Negativity
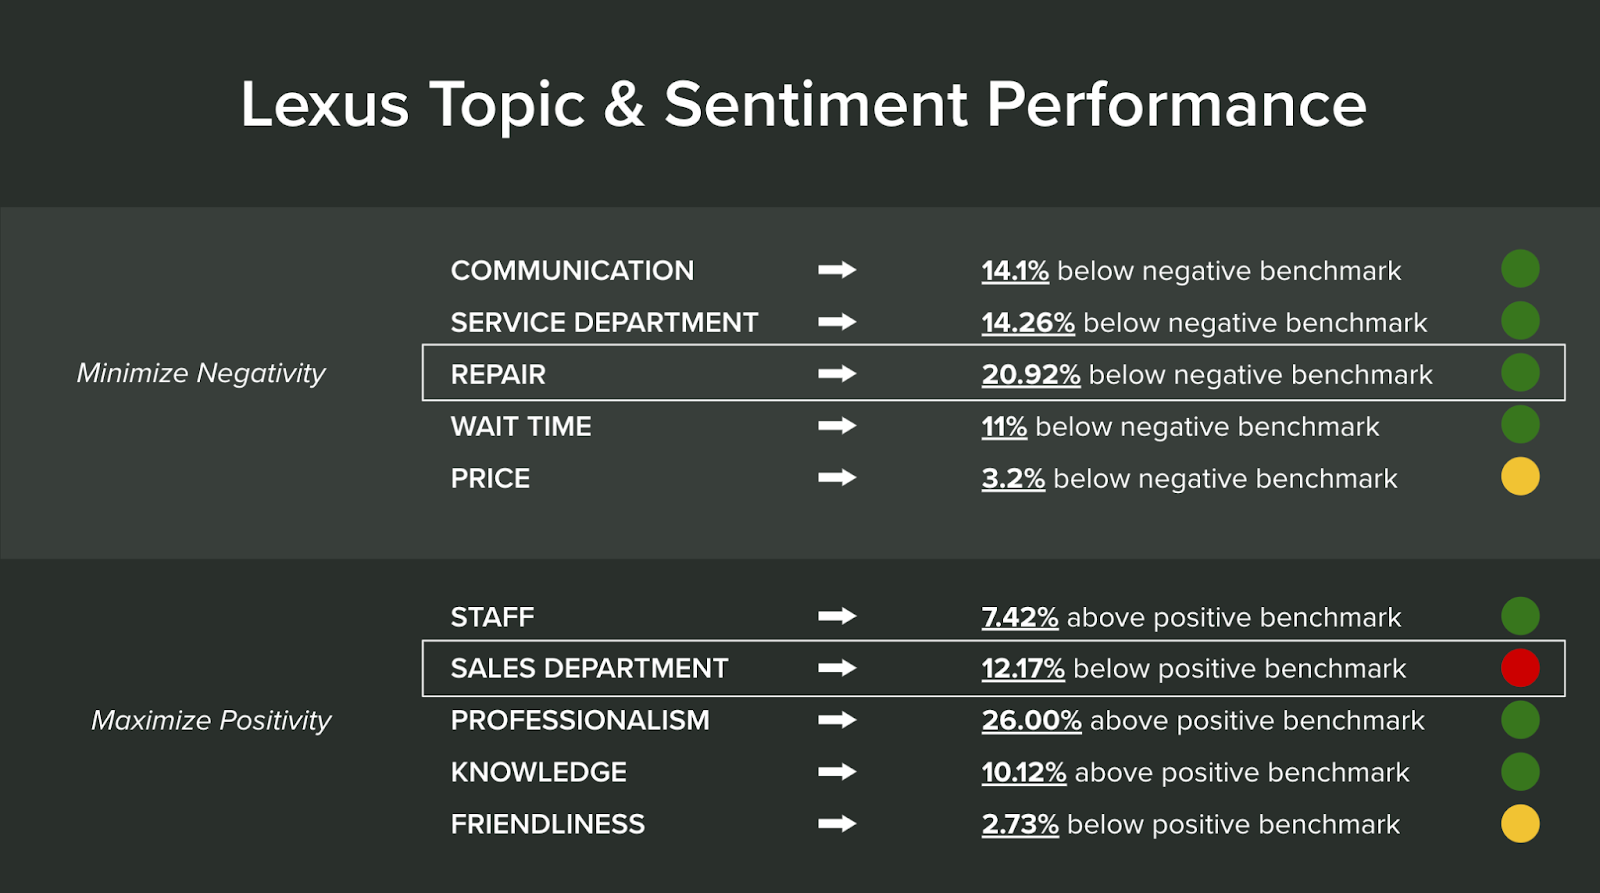
Lexus winning begs the obvious question: why?
Beneath its impressive reputation stats, we can clearly see what drives brand sentiment.
Lexus is world-class at minimizing negativity.
The 10 topics you see above are the 5 most frequently mentioned topics in negative reviews and the 5 most frequently topics mentioned in positive reviews.
These 10 drive every brand’s reputation. If you’re going to focus on improving any, focus on these 10. We topic-tagged and analyzed 1.1M reviews to identify these patterns.
To look under the hood, we compared Lexus’s performance vs. the industry averages in each topic.
In every topic in the minimizing negativity category, Lexus outperforms the industry. It gets a staggering 21% fewer negative mentions of REPAIR (repair issues).
However, it has one weakness—fewer positive mentions of the sales department than average. Generally speaking, good experiences with sales staff are the most common scenario producing a positive review.
Lexus is #1 in our rankings and still has room for improvement.
To contrast, let’s look at Toyota.
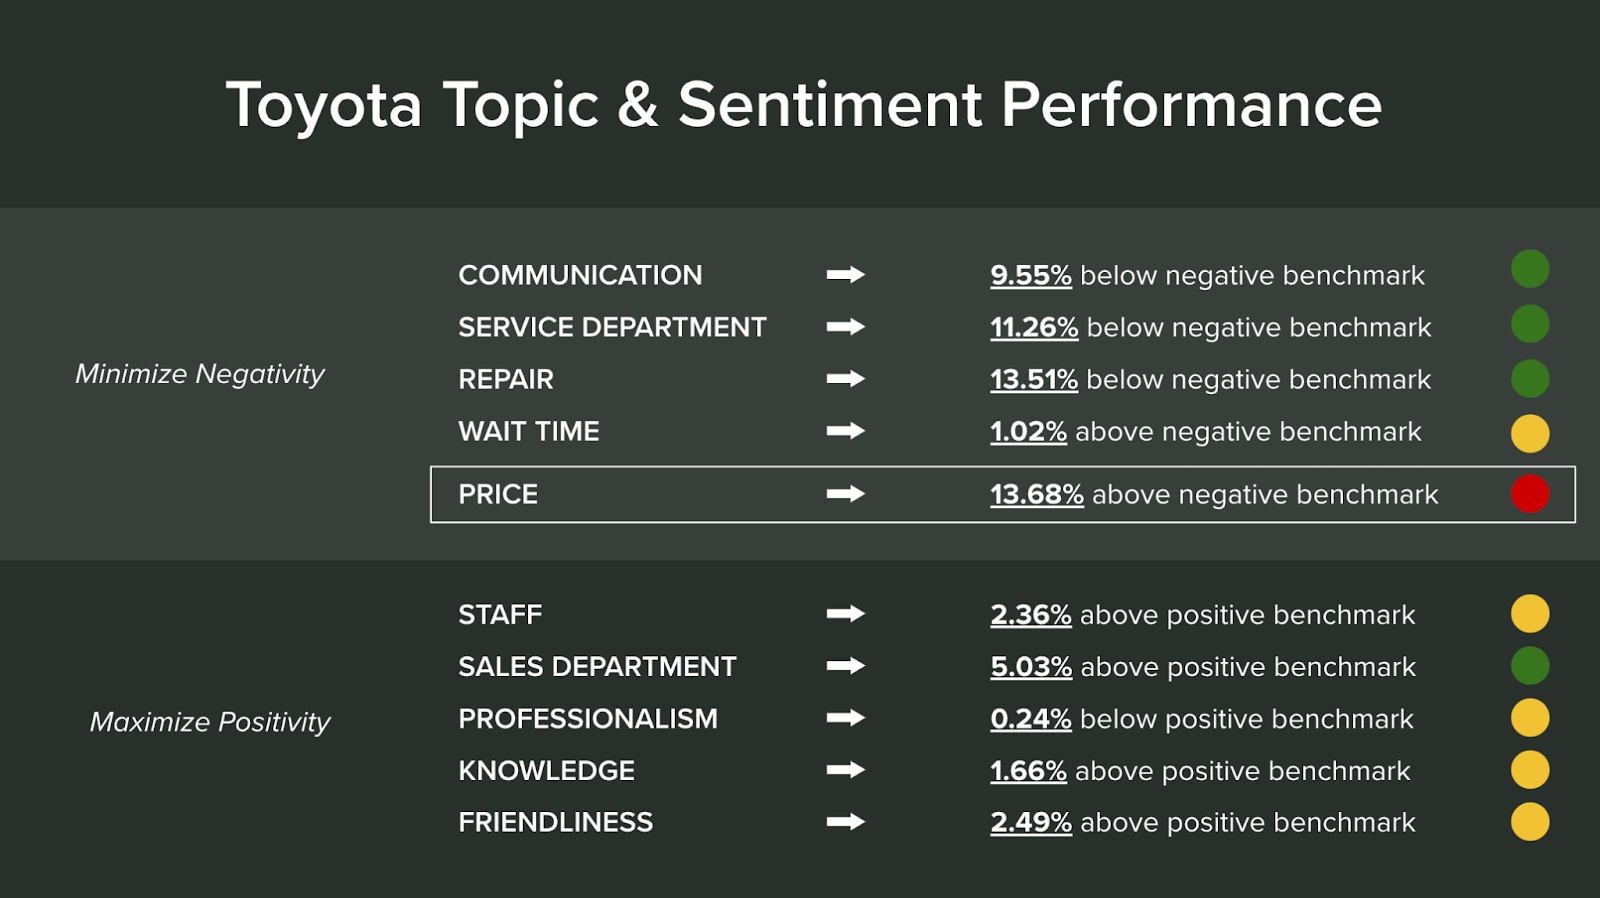
Toyota is also beating or matching industry benchmarks across the board.
Although it is beating the negativity benchmarks performing well, Toyota does so by less than Lexus in the top grouping. For the most part, Toyota matches industry standards in the positivity grouping.
Negative mentions of PRICE are a (un)healthy 13% above the benchmark and should definitely be a point of focus for the brand. Our research suggests that price-related issues are commonly associated with miscommunication with the service customer.
Looking at our topic data, Toyota has 5% more positive mentions of PRICE, while Lexus has 25% fewer positive mentions of PRICE. This suggests that Toyota customers are more price-aware, which aligns with the buyer profiles of the two brands.
A quick look at other non-luxury brands tells me Toyota can improve here. There is a wide range of outcomes; Honda, for example, has similar problems with its negative PRICE mentions at nearly 20% over benchmark, while Hyundai has something figured out, with negative mentions 24% below benchmark.
See how other brands compare.
VISUALIZE
Meet the Scorecards
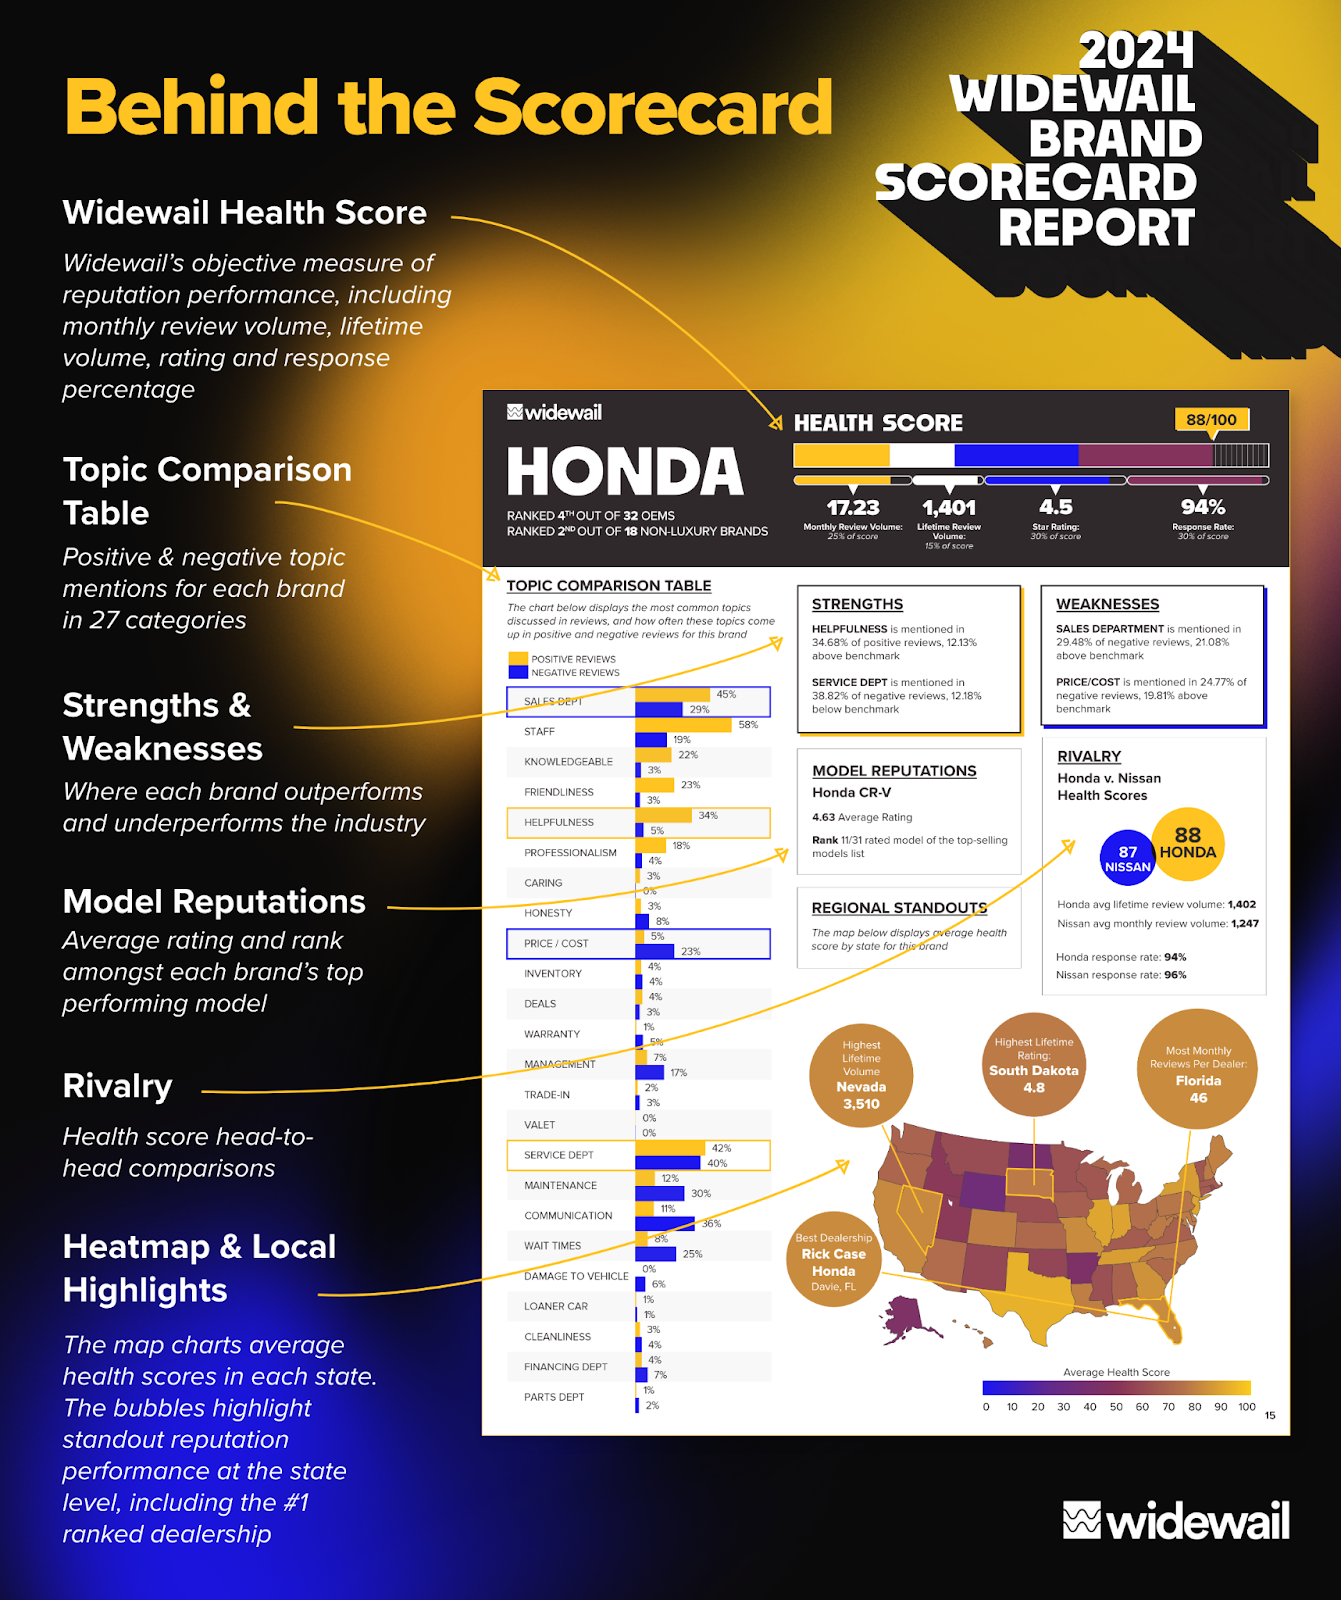
We've built scorecards for every brand in the 2024 Brand Scorecard Report.
Congrats to Lexus!
More REV in 3 weeks - Jake

